The saying "I only trust statistics that I have falsified myself" can certainly be applied to some modeling results.
The US Department of Energy (DOE) recently published a report that looks at the future of US LNG exports and their global impact, based on a number of different scenarios. The two most important assumptions are the so-called DP (Defined Policies) Unconstrained and DP Existing FID scenarios. The conclusions presented in the report do not seem plausible compared to scenarios from industry players and renowned consultants and can be seen as a kind of outlier, especially regarding the projected growth of the LNG trade until 2050.
The results were determined using the Global Change Analysis Model (GCAM). The report contains a lot of data, but with regard to key assumptions, in particular cost assumptions, the report is almost completely silent (note: this approach reminds me of many a report produced in Austria in which some, completely incomprehensible, figures/data seem to fall from the sky). The report notes that US LNG exports are based on relative competitiveness against other sources, such as LNG from other countries, availability and competitiveness of imported pipeline gas and domestic gas production, but it is not possible to read from the report the cost assumptions regarding these alternatives. This data is essential to understand how US LNG could lead to higher global natural gas demand, how other LNG supplies, import pipeline gas, domestic production and other fuels (mainly coal) and renewables could be replaced by US LNG.
Assuming the known, realistic, full cost of US LNG exports for delivery to Europe or Asia is in the range of $10-11/MMBTU, it is reasonable to ask how US LNG could replace other sources of LNG, particularly Qatar, renewables, coal and oil on a competitive basis. This would require prices of < $5/MMBTU (as in 2019). These prices, over longer periods of time, would simply make LNG liquefaction plants uneconomical. This is also in light of the fact that Qatar can supply at around half the US LNG price, namely around $5-6/MMBTU.
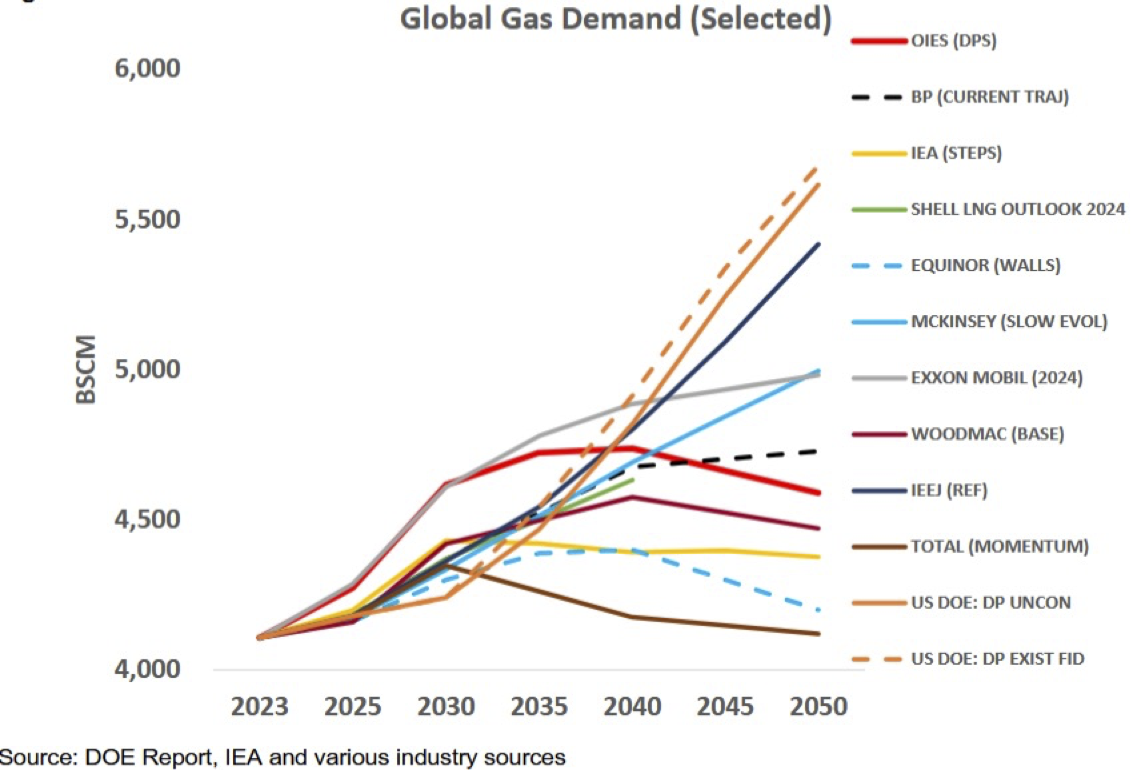
The report shows a global demand for natural gas as illustrated in the following graph. The orange solid line shows the demand according to the DP Unconstrained scenario and the orange dotted line shows the demand according to DP Existing FID (note the y-axis starts at 4 trillion Nm3 per year). It is clear to see that both scenarios are around 20% above the consensus value drawn up by key players and experts - this is very high.
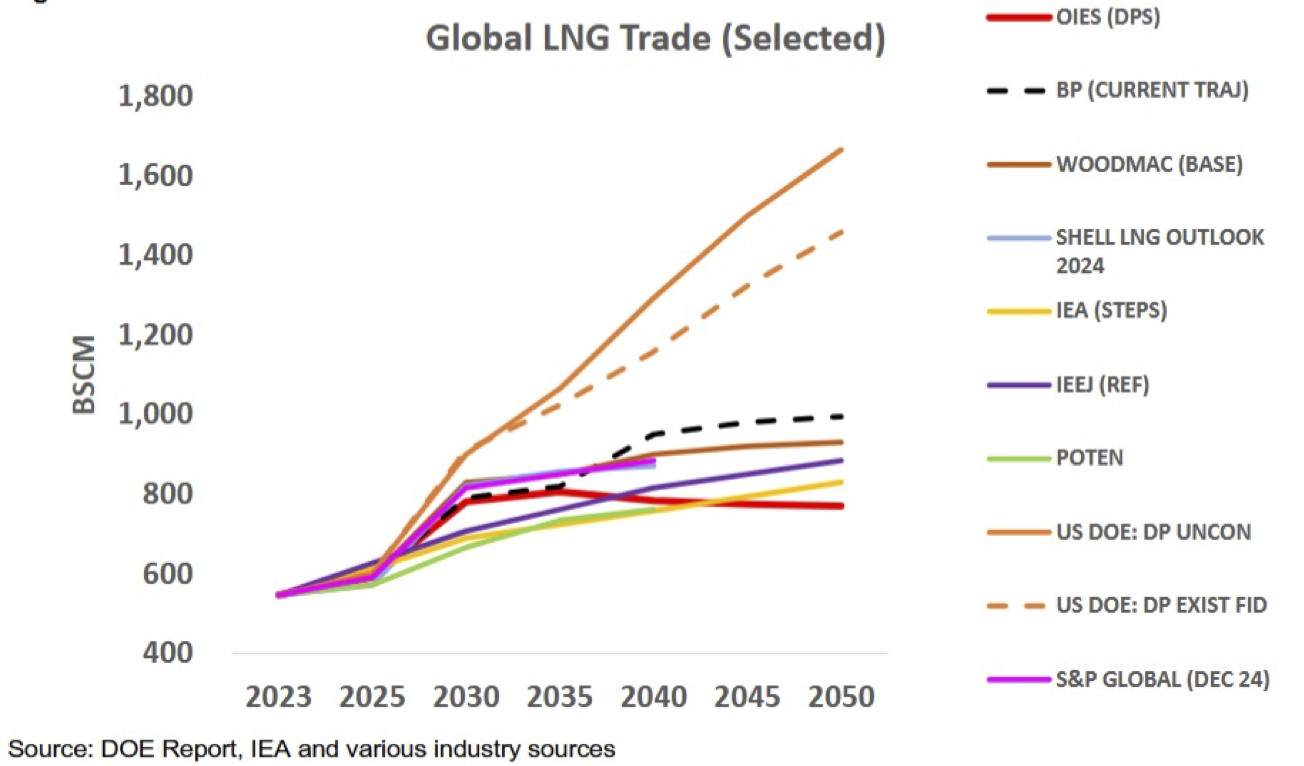
According to the scenarios mentioned, global LNG trade would develop as follows - see the following chart. The orange solid line represents the DP Unconstrained and the orange dotted line the DP Existing FID scenario. The values for global LNG trade are > 70-80% higher than those of other major market players such as Shell, BP or the IEA.
These two scenarios (DP Unconstrained and DP Existing FID) lead to the following very implausible, sometimes bizarre, statements:
- Norway stops pipeline exports to the EU and instead exports around 150 bcma of LNG - this is based on a current level of 6 bcma of LNG exports. Why Norway should end pipeline exports is not clear from the report;
- Russia imports approx. 75 bcma LNG in 2050. Why Russia should import LNG remains unclear;
- Japan imports approx. 120 - 130 bcma in 2050 - from a current level of 85 bcma, which is trending downwards. This with an ageing and declining population;
- Pakistan will import approx. 75 bcma in 2050; currently 10 bcma. In Pakistan, demand will undoubtedly increase but not to such an extent as LNG will simply be too expensive. This is a question of affordability;
- Central Asia imports 30 bcma of LNG even though there is no access to the sea - except Georgia;
- All regions in Africa import significant amounts of LNG although some countries currently export LNG and there are still sufficient gas reserves;
- North Africa (Algeria etc.) is expected to export 150 bcma according to the DP Unconstrained scenario - several times the current level - despite significantly falling production, sharply rising domestic demand and a lack of feed gas for LNG in these countries;
- Southern African countries (Tanzania and Mozambique) will not export LNG despite Coral FLNG recently coming online and additional LNG liquefaction plants under construction;
- Belarus, Moldova and Ukraine will export LNG although none of these countries have LNG liquefaction plants in operation and no such plants are planned;
- South Asian countries such as Bangladesh, Afghanistan, Bhutan, Sri Lanka, Maldives and Nepal will export LNG. How this will work remains unclear;
- Canada is to export 150 bcma. Although Canada will certainly export more than at present, the volume mentioned seems to be far too high;
- India's imports are expected to be 260 bcma in the DP Unconstrained scenario and 230 bcma in the DP Existing FID scenario; India will certainly increase LNG imports considerably in the foreseeable future, but not to this extent, as this is a question of affordability.
The sometimes bizarre results quoted are just some of the highlights but the main argument is that the figures quoted for both LNG exports and LNG imports are simply not credible.
The main difference between the DP Unconstrained and DP Existing FID scenarios is a huge increase in LNG exports from the US. The impact is twofold: on the one hand, gas demand in the importing countries is expected to increase and, on the other, US LNG is expected to replace LNG supplies from other countries. As a consequence, natural gas production in these countries is expected to fall. The difference in volume between the DP Unconstrained scenario and the DP Existing FID is approx. 150 bcma in 2030 and 340 bcma in 2050.